November 13, 2020

With the rise of big data, more companies are collecting and storing vast amounts of information about their business, revenue, and customers. However, while the adoption of big data has accelerated significantly in recent years, many companies are struggling to extract meaningful information from the abundance of data at their fingertips. Others are unable to take full advantage of their data due to cumbersome dashboards that are difficult to use and laborious, manual data retrieval methods.
Depending on the data collected, there are various methods of analysis to consider. However, the quantity of data alone can be overwhelming for professionals not trained in data science or similar disciplines. The process of sifting and organizing the data to find the appropriate metrics to measure can lead to analysis paralysis — in which the decision maker becomes so overwhelmed with the volume of options that they end up making no decision at all.
To that end, the importance of data visualization is growing at an increasing rate and is becoming a critical asset for companies, with the power to completely revolutionize the way data is accessed, presented and used.
What is Data Visualization?
Data visualization is the process of transforming, organizing, and presenting large, complex datasets in a visual manner. Done well, these visualizations accelerate the viewer’s ability to understand and identify the most relevant gems hidden within the data. Done poorly, data visualization can present misleading “findings” due to lack of context or underlying data quality.
For example, this interactive visualization, with corresponding screenshot below, plots Airbnb pricing and availability information across the city of San Francisco, in real time. It also shows acceptance rate data, price ranges by neighborhood, and other, incredibly telling information.
A visual format makes the data easier to understand, accelerates and informs decision-making, improves access to data, and ultimately, draws your audience in more effectively.
People are Visual
Why data visualization is important in today’s digital economy becomes infinitely clearer when we look at the biology of human beings. Our brains were not built to digest large amounts of information in the form of text or numbers. In fact, humans can process visual images 60,000 times faster than text and 90% of information transmitted to the brain is visual.
Audiences respond better to visual representations of data, as it is more comfortable for the brain to see a graph or chart than to read, understand and convert textual or numerical information into a mental visualization. Even traditional data visualization techniques like bar graphs and pie charts can convert complex data into easily digestible representations of data. More advanced visualizations such as bubble graphs, heat maps or even frame diagrams and Gantt charts provide a more comprehensive yet still easily understandable visualization.
Easily Digested and More Compelling
Unlike textual or numerical representations of data, data visualization does not work against human biology. Instead, data is represented visually, a more easily digested form of communicating information to the brain. Visual representations of data mean that data and non-data oriented people are better able to consume vast amounts of data to answer important questions quickly.
Further, visuals can tell better stories than blocks of texts or charts, allowing businesses to make stronger value propositions. To demonstrate, data visualizations are extremely powerful in marketing — they show results, catch the attention of a business’s target audience, and pull them in by allowing them to visualize their own stories based on the data presented.
With big data quickly becoming one of the most valuable resources for businesses to tap into, the capabilities of data visualization are becoming increasingly essential.
Access to Live, Up-to-Date Information
Good data visualization is a powerful tool that brings employees, decision-makers and other parties together — much faster and effectively than traditional methods such as static reports and spreadsheets. A well executed data visualization plan democratizes data for your organization across all functions so that everyone is working from the same set of measurements.
Clear and effective communication is highly relevant to companies on two fronts; firstly, it can measurably improve productivity and increase the effectiveness of operations. Secondly, clear and effective communication can enhance levels of job satisfaction, reduce absenteeism, and employee turnover rates. As such, businesses that seek to leverage the capabilities of data visualization should be mindful that sharing regular and relevant data insights can be of equal benefit to decision-makers and employees.
With the help of new data visualization technology, companies can retrieve relevant information almost instantaneously and with little effort. What follows is the ability to then share it with employees and decision-makers, while optimizing internal efforts that would otherwise be focused on cumbersome data retrieval and organization tasks.
Faster, More Informed Decision-Making
For companies, strong data visualization reflects a higher ability to quickly and more effectively retrieve, grasp and share complex information. As a result, decision-makers can make data-driven decisions in less time, creating an advantage in the marketplace.
In the example below, the data is stored in JavaScript Object Notation (JSON) format, making it difficult to interpret and draw conclusions at first glance. Data visualization is a powerful tool to tell the story in an effective and compelling way, allowing decision-makers to respond accordingly.
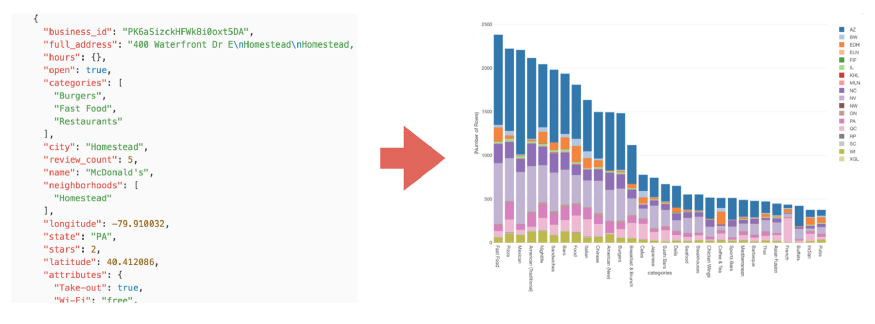
Source: Medium
Data visualization allows companies to dig deeper into their data. As opposed to staying metaphorically in the dark and making decisions based on assumptions, data visualization can identify patterns and trends that have been hiding within a company’s untapped data.
For management in particular, who often has to make decisions fluidly in critical areas such as staffing or inventory, it is much easier to consume a well-constructed data visualization which can bring multiple data dimensions together than to devote time to scanning and interpreting a matrix of numbers. Good data visualization allows management to increase the accuracy, transparency, and speed of decision-making processes, making better, data-driven decisions along the way.
Data visualization is thus vital for businesses, helping leaders develop powerful and effective strategies before competitors can catch up.
With the advent of big data, businesses have an abundance of information available to them. However, how to retrieve, consume, and present this information effectively is a critical consideration. Data visualization allows companies to present information to their audiences in an easily digestible and compelling way. In turn, companies can better connect with their customers, employees and decision-makers to make effective and data-backed decisions. Ultimately, data visualization allows you to create data representations in a way that the human brain was designed for. Contact our data experts today to learn more about how data visualization can transform, democratize, and accelerate your decision-making process. Read more.